Current Approaches to Effective Crisis and Contingency Planning
The Skinny
- Proactive Planning: Organizations must engage in proactive planning to anticipate potential crises and minimize their impact.
- Comprehensive Strategies: Effective crisis management requires comprehensive strategies that include risk assessment, resource allocation, and communication plans.
- Continuous Improvement: Continuous improvement through regular reviews and updates to contingency plans is essential for maintaining preparedness.
This article explores the latest strategies and implementation plans for effective contingency planning during a crisis. This comprehensive piece examines how organizations can safeguard business operations, mitigate risks, and strengthen physical and cyber security measures to navigate disruptions effectively. It highlights key approaches to building operational resiliency, maintaining continuity under pressure, and accelerating recovery in the aftermath.
As I prepare this article, Los Angeles is experiencing one of the worst wildfires in history, with thousands of homes and businesses destroyed. Please consider this event as I write this article, as there is no greater teacher than experience.
As the California fires progress through the disaster cycle, we will learn about the successes and failures of governments, first responders and businesses. Unfortunately, many homes and businesses will not be restored after this event because the devastation and loss will be too great to recover successfully.
The disaster or emergency management cycle refers to the four key phases of managing an emergency: mitigation, preparedness, response and recovery. Mitigation focuses on reducing risks before an emergency occurs, preparedness involves planning and training to respond effectively, response is the immediate action taken during an emergency, and recovery aims to restore affected areas after the event has passed.
We will discuss these phases of a disaster in detail later in the article.
Safeguarding Operations and Mitigating Risks
To begin this process, we must answer two fundamental questions: what are we protecting, and what are we protecting against? Whether a corporation or government, you produce a product or service. The inability to make that product or service is called strategic risk.
One way of measuring strategic risk is to understand the internal and external impacts of consequences and loss when we cannot produce our product or service. Internal impacts include implications to people, equipment, finances, and reputation.
People are impacted by injury or death due to an event, whether workplace violence or an earthquake. Loss of life and injury is related to loss of intellectual property, research, or even company leadership.
Impacts on equipment refer to the equipment needed to accomplish the mission. They can be very broad in scope; for example, losing internet access for a few hours is not a significant impact unless you are a data center, where data loss for several minutes can result in millions of dollars lost. Or consider a hydroelectric generator that can take several years to replace. The mission, scale of the loss, and scope can change from organization to organization.
Impacts on finances refer to both revenue and financial resilience. Revenue speaks to income and continued cash flow. In contrast, financial resilience speaks to cash on hand to withstand the impacts of an event and come out the other end in a position to continue providing services on a full scale. A million-dollar impact on an organization that makes three million a year could be devasting. In contrast, an organization that earns five hundred million dollars a year would find one million dollars negligible. In this case, we must consider the size and scale of the event to make good pre-event decisions.
Impacts on reputation refer to how clients feel about us post-event. Were we there for our clients and served them throughout, or did we fail them and cause their failure when we could not provide our service?
Impacts on reputation also refer to your impact on others. Specific impacts can be wide-ranging due to critical interdependence. For example, the electric grid touches almost everything. If power is lost for an extended period, other infrastructures can fail, causing a cascading effect for an extended outage. As we have experienced in California, the impacts of water loss at the hydrants resulted in billions of dollars in damage.
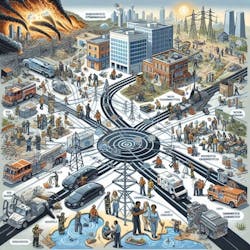
Cascading Effects
Cascading effects refer to a chain of events triggered by an initial incident, where the impact on one system or function propagates to other systems or functions due to their interdependence. This can lead to widespread disruptions and significant consequences across multiple areas.
Here are some examples of cascading failures.
Natural Disasters:
- Earthquake: An earthquake can damage infrastructure, leading to power outages and disrupting water supply systems and communication networks. This can hinder emergency response efforts and exacerbate the overall impact of the disaster
- Hurricane: A hurricane can cause flooding, which may lead to contamination of water supplies. The flooding can also damage roads and bridges, making it difficult for rescue teams to reach affected areas.
Economic Crises:
- Financial Market Crash: A significant drop in stock market values can lead to a loss of investor confidence, causing banks to tighten lending. This can result in reduced consumer spending and business investments, leading to job losses and further economic decline.
- Supply Chain Disruption: A disruption in the supply chain, such as a significant port closure, can lead to shortages of essential goods. This can affect various industries, leading to increased prices and economic instability.
Technological Failures:
- Cyberattack: A cyberattack on a major financial institution can compromise sensitive data, leading to economic losses and a loss of trust in the banking system. This can cause a ripple effect, impacting other financial institutions and the broader economy.
- Software Failure: A critical software failure in a hospital's system can disrupt patient care, leading to delays in treatment and potentially life-threatening situations.
These examples illustrate how interconnected systems can be and how an initial incident can trigger cascading effects across different sectors.
Here is a specific example of a cascading failure.
2003 Northeast Blackout
In 2003, the United States experienced the Northeast Blackout, which had significant cascading effects, impacting various aspects of society and infrastructure. According to Practical Engineering, in the February 2022 article “What Really Happened During the 2003 Blackout,” they identified some of the key consequences of that event:
- Widespread Power Loss: The blackout affected approximately 55 million people across the Northeastern and Midwestern United States and parts of Canada. Major cities like New York, Toronto, and Detroit experienced complete power loss.
- Economic Impact: The blackout resulted in an estimated economic loss of over $10 billion due to halted business operations, lost productivity, and spoilage of perishable goods.
- Transportation Disruptions: Public transportation systems, including subways and trains, were severely disrupted. The subway system was shut down in New York City, stranding thousands of commuters.
- Water Supply Issues: Many areas experienced water supply problems as electric pumps failed. This led to a lack of water pressure and, in some cases, contamination concerns.
- Emergency Services Strain: Emergency services were overwhelmed with calls, and the lack of power affected their ability to respond efficiently. Hospitals had to rely on backup generators, and some faced challenges in maintaining critical operations.
- Communication Breakdowns: Telecommunications were disrupted, making it difficult for people to contact emergency services or stay informed about the situation.
- Social and Psychological Effects: The sudden loss of power and the uncertainty of the situation caused stress and anxiety among the affected population. There were also reports of increased crime rates in some areas during the blackout2.
Can you imagine today's cost of a cascading event if we lose data centers and internet services? When you have a poor reputation, you may lose customers completely, and in some cases, you may even be subject to civil suits for negligence.
Identifying Risks and Risk Mitigation
There are many forms of risk assessment, but whatever assessment methodology, tool, or solution you choose, ensure that it provides you with the critical information you need to make sound decisions. We strongly recommend a qualitative and quantitative risk assessment considering all human-made, accidental, and technological hazards. A checklist is great for compliance but serves little use when identifying risk-based events and their impacts on the organization's strategic mission.
One method to support a good risk assessment is fault tree analysis (FTA), sometimes known as event tree analysis. FTA identifies the possible causes of a system failure. Essentially, we identify low-level failures that can result in system failure due to a lack of redundancy.
A FTA graphically illustrates the different potential causes of a failure in a diagram. Using FTA, you can determine what factors contributed to an event (known as a failure) and the probability of it occurring. Once the major causes are identified and addressed, FTA can help teams prioritize corrective actions.
In FTA, we have “and gates” and “or Gates to demonstrate the fundamental components used to model the logical relationships between different events leading to a system failure. In Fault Tree Analysis (FTA), AND and OR gates represent different logical relationships between events that can lead to a system failure. Here's a detailed explanation of each:
All Risks Are Shared
Once you have completed your risk, threat, and vulnerability assessment, you should consider the Concept of a shared operations center in terms of cyber, physical operations, environmental health and safety, and business continuity.
AND Gate
- Definition: An AND gate indicates that all input events must occur simultaneously for the output event to happen. It represents a situation where multiple conditions need to be met for a failure to occur, such as system redundancy.
- Symbol: The symbol for an AND gate is a flat-topped shape with multiple input lines converging into it.
- Example: If a system failure occurs only when both a power supply and a backup generator fail, these two events would be connected by an AND gate. This means both failures must happen together for the system to fail.
OR Gate
- Definition: An OR gate indicates that at least one of the input events must occur for the output event to happen. It represents a situation where one of several conditions can cause a failure. Or gates represent single points of failure.
- Symbol: The symbol for an OR gate is a curved shape with multiple input lines converging into it.
- Example: If a system failure can occur due to either a power supply failure or a software malfunction, these two events would be connected by an OR gate. This means that either failure can independently cause the system to fail.
Here is an example of a Fault Tree Analysis for a Power Outage:
Top Event: Power Outage
1. Transmission Line Failure (OR Gate)
- Conductor Failure (AND Gate)
- Conductor Breakage
- Conductor Corrosion
Insulator Failure (AND Gate)
- Insulator Cracking
- Insulator Contamination
2. Substation Failure (OR Gate)
Transformer Failure (AND Gate)
- Overheating
- Insulation Breakdown
Circuit Breaker Failure (AND Gate)
- Mechanical Failure
- Electrical Fault
3. Generation Failure (OR Gate)
Generator Breakdown (AND Gate)
- Mechanical Wear
- Cooling System Failure
Fuel Supply Interruption (AND Gate)
- Fuel Shortage
- Supply Line Damage
In this example, the top event is the power outage. The intermediate events (e.g., transmission line failure, substation failure, generation failure) are connected to the top event using OR gates, indicating that any failures can cause a power outage. Each intermediate event is further broken down into essential events (e.g., conductor breakage, insulator cracking) using AND gates, indicating that multiple conditions must be met for the intermediate event to occur. An FTA diagram helps identify potential points of failure and their causes, allowing for better risk management and mitigation strategies.
About the Author

Jeffrey A. Slotnick CPP, PSP
President of Setracon ESRMS
Jeffrey A. Slotnick, CPP, PSP
President, Setracon ESRMS
Chair, Board of Advisors Robotic Assistance Devices
Community Vice President, ASIS International
Board of Directors, Jewish Federation of Greater Seattle
Founder Safe Washington
United States Army Engineer Corp, CSM Retired
Trusted Advisor | Leader | Change Agent | Risk Consultant | ESRM Advocate | Security Management Professional | Physical Security Specialist | Master Quality Management Systems Professional | Public Speaker | Author | Media Consultant.
Mr. Jeffrey A. Slotnick, CPP, PSP, is an internationally known Enterprise Security Risk Consultant with over 28 years of experience. Jeff is peer-recognized as a “Thought Leader and Change Agent. He focuses on all Enterprise Security Risk Management facets, including quality management programs, risk, vulnerability, threat assessments, Emergency Response Planning, Business Continuity Planning, and Physical Security System Master Planning, Design, and Integration. As a curriculum developer and master trainer, Jeff advocates for quality professional development and training of security, law enforcement, and military personnel. He is a former member of the North American Board. He is a Community Vice President for ASIS International and a Faculty Advisor for the University of Phoenix Bachelor of Science in Cyber Security and Security Management Degree Program.
Jeff is a regular contributor to Security Executive Magazine and SecurityInfoWatch.com